Tracking the right metrics separates top sales teams from the rest. Whether you lead a B2B field team, an inside sales org, or a high-volume call center, this guide covers 12 effectiveness metrics, including what they measure, how to calculate them, and how to use them to improve rep performance.
12 sales effectiveness metrics you need to track
These metrics give you a clear view of how your team performs at every stage of the sales process. Track them consistently, and you'll know exactly where to focus your coaching efforts.
📊 Metric | 🔍 What it measures | 📈 Formula |
Quota attainment | % of reps hitting targets | (Reps who hit quota ÷ Total reps) x 100 |
Win rate | % of opportunities that close | (Closed-won deals ÷ Total opportunities) x 100 |
Sales cycle length | Time from first contact to close | Total days to close ÷ Number of deals |
Lead conversion rate | % of leads becoming opportunities | (Qualified opportunities ÷ Total leads) x 100 |
Average deal size | Typical value of closed deals | Total revenue ÷ Number of closed deals |
Customer acquisition cost | Cost to win each customer | Total sales & marketing costs ÷ New customers |
Pipeline coverage | Deals in progress vs. quota and total pipeline value | Pipeline value = Sum of all open opportunity values / Coverage = Total pipeline value ÷ Quota target |
Lead response time | Speed of first follow-up | Total time to respond ÷ Number of leads |
Time spent selling | Hours on prospect-facing work | Prospect-facing hours ÷ Total working hours |
Activity completion rate | % of required tasks completed | (Completed activities ÷ Required activities) x 100 |
Customer lifetime value | Total revenue per customer relationship | (Average purchase value × Purchase frequency × Average customer lifespan) − Gross margin |
Revenue per rep | Revenue generated per salesperson | Total revenue ÷ Number of reps |
1. Quota attainment
This metric shows what percentage of reps hit their sales targets and serves as one of the clearest signals of overall team health.
Formula: (Reps who hit quota ÷ Total reps) x 100
A low percentage usually points to a deeper issue, whether in training, coaching, or lead quality. Track it monthly and quarterly, then break it down by team, territory, or product line to spot patterns.
The industry average sits around 60% of reps hitting quota in a given quarter, and if you’re consistently below that, the issue is more likely tied to territory design, quota setting, or lead quality than individual performance.
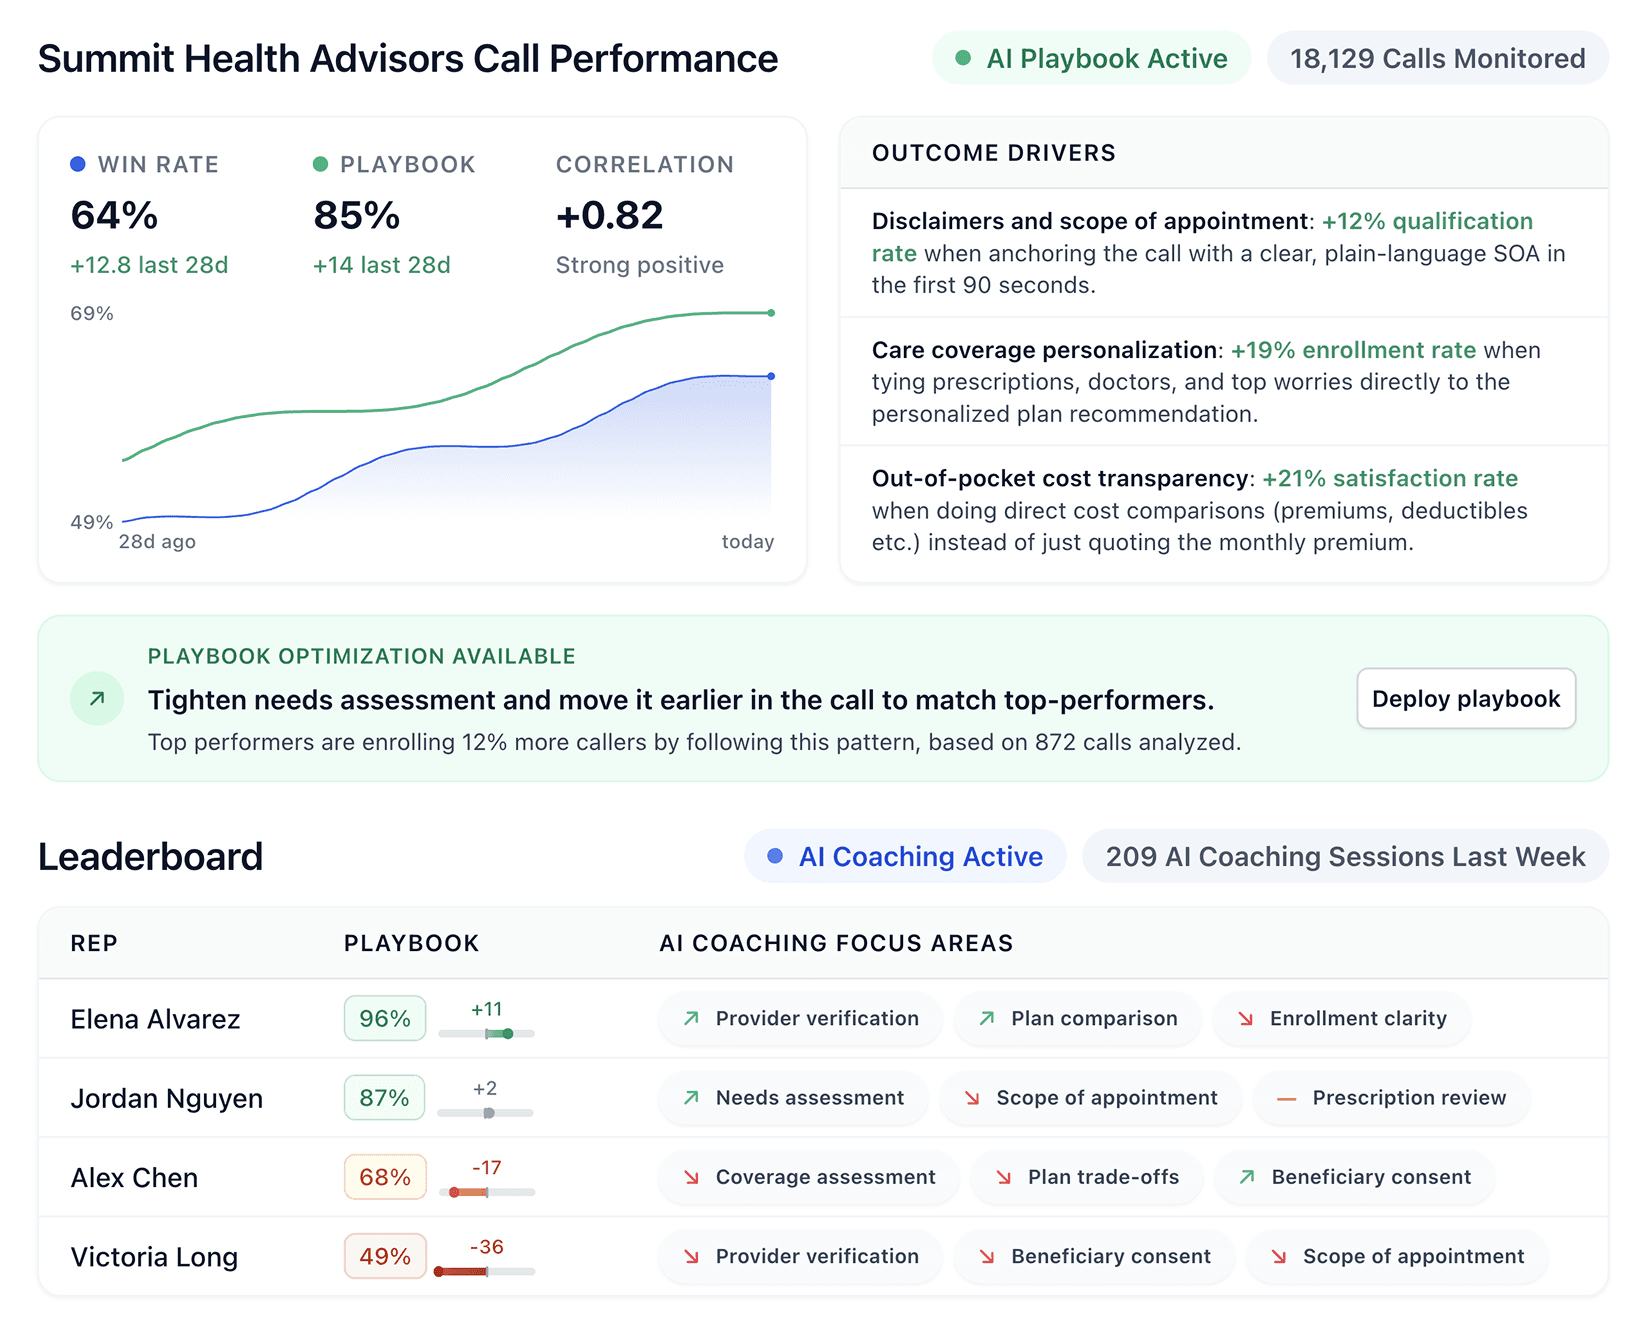
2. Win rate
Win rate measures how many opportunities turn into closed deals, giving a direct view into how effectively reps convert qualified prospects.
Formula: (Closed-won deals ÷ Total opportunities) x 100
The average B2B win rate is around 20 to 21%, while top teams reach 30% or higher. To get a clearer picture, break this down by deal source and size, since inbound and outbound performance often differ, and a strong SMB motion can mask weaker enterprise execution.
3. Sales cycle length
This tracks the average time from first contact to a closed deal, with shorter cycles generally indicating more efficient revenue generation.
Formula: Total days to close all deals ÷ Number of deals closed
Cycle length should be analyzed by deal type, since enterprise deals naturally take longer and can distort averages.
Most slowdowns happen after the demo and before the proposal, so when deals consistently stall at the same stage, it usually reflects a process issue rather than a rep-level problem.
4. Lead conversion rate
This shows how many leads turn into qualified opportunities, linking marketing input to sales output.
Formula: (Qualified opportunities ÷ Total leads) x 100
When conversion drops, the issue could sit in lead quality, qualification, or follow-up. Breaking this down by source often reveals that one underperforming channel is pulling down the overall average.
5. Average deal size
Average deal size reflects the typical value of closed deals and helps indicate how well reps position and expand opportunities.
Formula: Total revenue from closed deals ÷ Number of closed deals
An increase often signals stronger positioning or upselling, while a decline may point to discounting or smaller target accounts. Comparing across reps can highlight gaps in qualification or pricing discipline.
6. Customer acquisition cost (CAC)
CAC measures how much it costs to acquire each new customer, including sales, marketing, and operational expenses.
Formula: Total sales and marketing costs ÷ Number of new customers acquired
Tracking this over time helps surface inefficiencies or shifts in competition. For B2B SaaS, the average CAC sits around $1,200 per customer in 2025, though it matters most relative to CLV, since rising CAC can still be sustainable if customer value grows faster.
7. Pipeline coverage and value
Pipeline value represents the total potential revenue across open opportunities, while pipeline coverage compares that number to your quota target.
Formulas:
Pipeline value = Sum of all open opportunity values
Pipeline coverage = Total pipeline value ÷ Quota target
Most teams aim for 3x to 5x coverage, but the distribution matters as much as the total. A pipeline filled with early-stage deals may appear healthy while still falling short, so breaking it down by stage gives a more accurate view.
8. Lead response time
This measures how quickly reps respond to new leads, which directly impacts conversion rates.
Formula: Total time to first response ÷ Number of leads
Speed plays a major role, with 78% of customers choosing the first vendor to respond. Delays beyond the first hour significantly reduce engagement, and after a full day, the opportunity often shifts elsewhere.
9. Time spent selling
This tracks how much of a rep’s time is spent on prospect-facing work compared to administrative tasks.
Formula: Hours on prospect-facing activities ÷ Total working hours
Salesforce's 2024 State of Sales report shows that reps spend about 70% of their time on non-selling tasks, including data entry, meeting preparation, and administrative work, leaving only 30% for actual selling.
Improving this comes down to removing friction and auditing where time actually goes, since internal meetings often take more time than expected.
10. Sales activity completion rates
This measures how consistently reps complete required steps in the sales process, such as follow-ups or demos.
Formula: (Completed activities ÷ Required activities) x 100
Low completion rates often signal unclear processes or steps that reps don’t value. Identifying which activities are skipped most often can help refine the process before pushing for stricter adherence.
11. Customer lifetime value (CLV)
CLV estimates the total revenue generated from a customer over the full relationship, shifting focus beyond the initial deal.
Formula: (Average purchase value × Purchase frequency × Average customer lifespan) × Gross margin %
Segmenting CLV by customer type helps identify which profiles are worth prioritizing. Reviewing it regularly ensures your targeting reflects current retention and expansion trends.
12. Revenue per rep
Revenue per rep shows how much each salesperson contributes, helping you assess both performance and capacity.
Formula: Total revenue ÷ Number of sales reps
Looking at this alongside activity metrics reveals whether gaps are due to volume or effectiveness. When a small number of reps drive most of the revenue, it often signals a dependency that can limit scalability.
What is sales effectiveness?
Sales effectiveness measures how well your team turns prospects into buyers. It focuses on whether reps actually move deals forward, not just how much activity they generate.
A rep can make 100 calls a day, but if those calls don’t lead to meetings or deals, the activity doesn’t matter. Effectiveness comes from how reps handle conversations and advance opportunities, which is where training, coaching, and the right tools come into play.
Sales effectiveness vs. sales efficiency
This is where the distinction becomes important. Sales effectiveness and sales efficiency are often used interchangeably, but they measure different things.
Efficiency tracks output, like calls made, follow-ups sent, or demos booked, while effectiveness looks at whether those actions move deals forward. A rep can hit every activity target and still see their pipeline stall, because activity alone doesn’t drive results.
Strong teams first define what effective selling looks like, then build systems to repeat it at scale.
Why these metrics matter for sales teams
Sales metrics matter because they show where revenue is being won or lost across your team.
In high-volume sales environments, where reps handle dozens of calls each day, every interaction carries weight, and without clear metrics, it becomes difficult to see which reps are struggling or why deals stall.
Tracking the right metrics helps you:
Find top performers and learn what makes them successful
Spot struggling reps early and give them targeted help
Predict revenue more accurately
Coach smarter with data instead of guesswork
Sales coaching software automates this tracking. It collects data from every call and surfaces insights you can act on today.
How to improve your sales effectiveness metrics
Sales effectiveness improves when you focus on the right problems and tie metrics to what reps actually do on calls. The goal is to move from tracking numbers to improving the behaviors behind them.
Start with your worst metric instead of your average
Blended numbers hide where performance breaks down. Focusing on the weakest metric shows where deals consistently slip, making it easier to prioritize coaching and fix what’s holding the team back.
Segment before you diagnose
A low win rate becomes useful once you break it down by rep, deal size, and lead source. This helps you isolate whether the issue comes from lead quality, how reps run conversations, or how different deal types are handled.
Review trends over time
A single bad month can happen, but repeated dips point to a pattern. Tracking trends helps you see whether changes are working and gives you a clearer signal before performance drops across the team.
Connect metrics to specific behaviors
Metrics reflect what happens in conversations. When a number drops, reviewing real calls shows exactly where deals lose momentum, which allows coaching to focus on the moments that actually influence outcomes.
How coaching software transforms these metrics
Coaching software transforms these metrics by turning data into actionable feedback tied to real sales conversations.
The teams that improve fastest are the ones that connect these numbers to what’s actually happening in conversations, then coach reps on the moments that influence outcomes.
Coaching tied to real behaviors
Generic feedback like “handle objections better” rarely changes performance because it lacks context. Metrics like win rate or conversion rate improve when reps understand what to say and when to say it.
Some tools analyze real conversations and learn from top performers. For example, Alpharun trains on your team’s calls, so feedback reflects how your team actually sells. Instead of broad suggestions, reps get guidance tied to specific moments that impact deal progression.
Guidance during live interactions
Metrics such as lead conversion rate and sales cycle length often come down to how reps respond in key moments. Once a call ends, the opportunity to influence that outcome is gone.
AI-supported coaching can surface prompts during live interactions, helping reps adjust in real time and keep deals moving forward while the conversation is still active.
Consistency in regulated and complex environments
For teams operating under compliance requirements, performance metrics are closely tied to accuracy and outcomes. Missed disclosures or incorrect language can affect both conversion and risk.
Built-in compliance tracking helps ensure reps consistently follow required steps, reinforcing correct behavior early and reducing issues that would otherwise show up later in performance data.
Coverage across more conversations
Metrics like time to first response and activity completion rates depend on consistency across a high volume of interactions. Gaps in coverage can lead to missed opportunities that never show up clearly in reports.
Extending support through AI-assisted systems allows teams to respond faster, qualify leads earlier, and maintain momentum across more conversations without adding headcount.
How to build a metrics-driven sales culture
Building a metrics-driven sales culture starts with connecting metrics to daily actions and decisions across the team. Metrics only influence performance when reps understand what they mean and how to act on them.
🔢 Step | 🎯 What to do | 💡 Why it matters |
Make metrics visible | Share dashboards or reports across the team | Keeps goals clear and builds accountability |
Connect metrics to coaching | Tie performance data to real calls or deals | Turns numbers into actionable improvement |
Celebrate wins | Recognize reps based on key metrics | Reinforces the behaviors that drive results |
Review metrics regularly | Set weekly, monthly, and quarterly reviews | Helps track progress and catch issues early |
1. Make metrics visible
Display key metrics where the team can see them, whether through dashboards or shared reports, so goals stay top of mind and progress is easy to track. Visibility builds accountability and creates a natural sense of ownership across the team.
2. Connect metrics to coaching
Reporting numbers alone doesn’t change outcomes. When a metric drops, use it as a starting point to review real calls or deals, identify where execution breaks down, and coach the specific behavior that needs to improve.
Some tools support this by surfacing patterns and guiding next steps based on your playbook.
3. Celebrate wins based on metrics
Recognition reinforces what matters. Highlight when reps hit key metrics and tie that success back to the behaviors that drove it, so the team understands what strong performance looks like in practice.
4. Review metrics regularly
Consistent review cycles keep everyone aligned. Weekly check-ins help address immediate issues, while monthly and quarterly reviews reveal trends, track progress, and guide adjustments across the team.
Choose the right sales coaching software
Choosing the right sales coaching software comes down to how well it helps your team act on performance data and improve real conversations. The goal is to find a tool that connects metrics to behavior, rather than just reporting activity.
Here’s what to look for:
Playbook-driven AI: Generic analysis often misses context. Look for software that learns your sales process, messaging, and compliance requirements so coaching reflects how your team actually sells.
Real-time capabilities: Post-call feedback helps over time, but real-time guidance improves the conversation as it happens. This directly impacts metrics like win rate and sales cycle length.
Compliance support: For regulated industries, coaching tools should reinforce required language and processes, including HIPAA, SOC 2 Type 2, and key disclosure requirements. This helps maintain consistency and reduce risk as reps ramp.
After-hours coverage: Leads don’t always come in during working hours. Tools that extend coverage can help qualify and route opportunities faster, which supports response time and conversion metrics.
Easy integration: Coaching software should fit into your existing workflow. Strong integrations with CRM and sales tools ensure data stays consistent and usable for both reporting and coaching.
Some platforms, like Alpharun, are built around these principles by combining playbook-driven coaching with real-time support and integrated compliance tracking, helping teams connect metrics to consistent execution.
Turn sales effectiveness metrics into better performance
Tracking 12 metrics means nothing if you can't act on them. Most teams collect data but struggle to turn it into real improvement.
Alpharun's sales coaching software helps you move from tracking to action:
Build custom playbooks from your best calls to improve win rates and quota attainment
Coach reps in real-time with sentence-level feedback to shorten sales cycles
Send targeted coaching notes and weekly performance rollups to keep metrics visible
Learn from top performers to lift deal sizes and conversion rates across your team
Automate scheduling and after-hours qualification with AI voice agents to increase time spent selling
Let Alpharun show you what's possible when metrics meet smart coaching. Book a demo today.
Frequently asked questions
What are sales effectiveness metrics?
Sales effectiveness metrics measure how well your team moves deals forward and converts prospects into customers. They focus on outcomes like win rate, conversion, and revenue rather than just activity.
Which sales effectiveness metrics should I track first?
You should track metrics like win rate, quota attainment, and sales cycle length first because they directly show how deals progress. These metrics give a clear starting point for identifying performance gaps.
How do you improve sales effectiveness quickly?
You improve sales effectiveness by focusing on your weakest metric, analyzing real conversations, and coaching specific behaviors. Breaking down data by segment also helps identify what needs to change more quickly.
Why is sales effectiveness important for revenue growth?
Sales effectiveness is important because it shows where revenue is gained or lost across your pipeline. It helps teams focus on the actions that actually drive conversions and improve overall performance.
What is the best way to track sales effectiveness metrics?
The best way to track sales effectiveness metrics is to use a system that captures data throughout your sales process and ties it to rep behavior. Dashboards and coaching tools help teams monitor trends, spot issues early, and act on insights consistently.